Project Settings
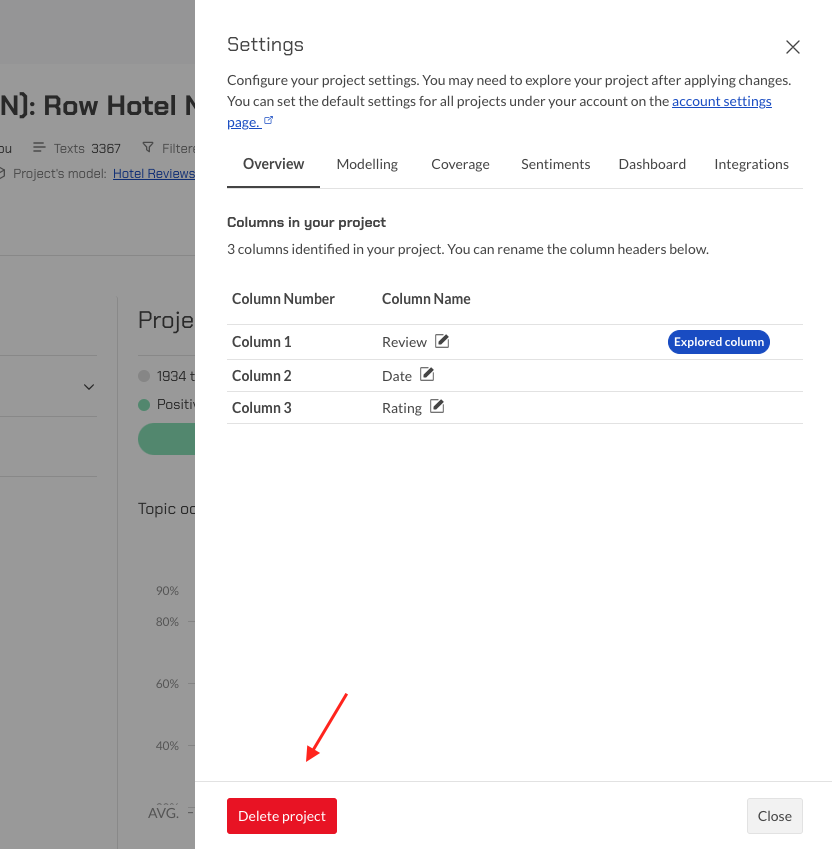
You can view and configure settings for your project in the Settings side panel by clicking the three-dot menu and selecting "Settings".

If you would like to configure the Default Project Settings for your account, so that all new projects that you create receive custom values for the settings, please refer to the Default Project Settings section.
Modelling
These are the general settings relating to the advanced modelling section of your project.
Here you can configure your analysis by specifying :
- If you want to include Empty Texts You may choose to include cells with empty texts in your analysis for statistical purposes. Empty texts are included by default.
- If you want to only include questions You may filter your data and only include cells that contain questions.
- The number of topics to return Topics are included in your analysis based on frequency. All pinned topics will be included in the analysis by default. The default number of included topics is 30.
- The maximum number of related topics generated per topic Related topics are terms which often occur with a particular topic. The related topics are not necessarily in the list of topics in your analysis.
- If you want to include metadata in your texts: If metadata exists in a given project, you can choose to add up to 3 metadata columns from a drop down menu. The information from the columns you specify will be added to the text examples of the topics - for better understanding and analysis. You can change the columns and see the result directly - no re-exploration is needed.
Coverage
Coverage allows you to get statistics for the texts that did not belong to any of the topics in the analysis. You will be able to see the percentage, sentiment and examples of the texts which do not match any of the topics as a separate 'Unclassified' topic in the Advanced Modelling page.
The default is to group texts not matching any of the topics of the project into the 'Unclassified' Coverage topic. When enabled, you can specify how the coverage analysis should be performed. The default setting is "All" which means that coverage is calculated for those texts that do not match any topic in the project. You can also select "Only pinned" which will cause coverage to be calculated only for those texts that do not match any of the pinned topics. If you do not want to analyse coverage, you can disable it.
Sentiments
The Sentiments settings can be used to fine tune the sentiment analysis for your project.
You can configure the following settings in the Sentiment sub-section:
- Select Active Sentiments. Which sentiments should be calculated and shown in the sentiment bar for every topic? You can choose maximum 3 out of 8.
- Show neutral sentiment. Show the neutral value of each topic alongside of the actual sentiment values. The value corresponds to the number of texts that were not covered by any of the selected sentiments. For each text, neutral is calculated by giving it the value 1 if none of the currently selected sentiments have any value. This calculation is the same regardless of which sentiment calculation method you use (see below).
-
Select the Sentiment calculation method. There are 2 ways to calculate sentiments for topics and texts. The sentiment, in each case, is calculated for each text and then aggregated to get the sentiment results on the topic, group or project level. The sentiment calculation method allows you to decide how they are calculated for each text.
-
"Aggregated Sum": Each sentiment gets a score which corresponds to how often that sentiment occurs in the text.
-
"Binary": A score of one is given to the highest scoring sentiment in a text and none to the others. This is the default method.
Machine Learning
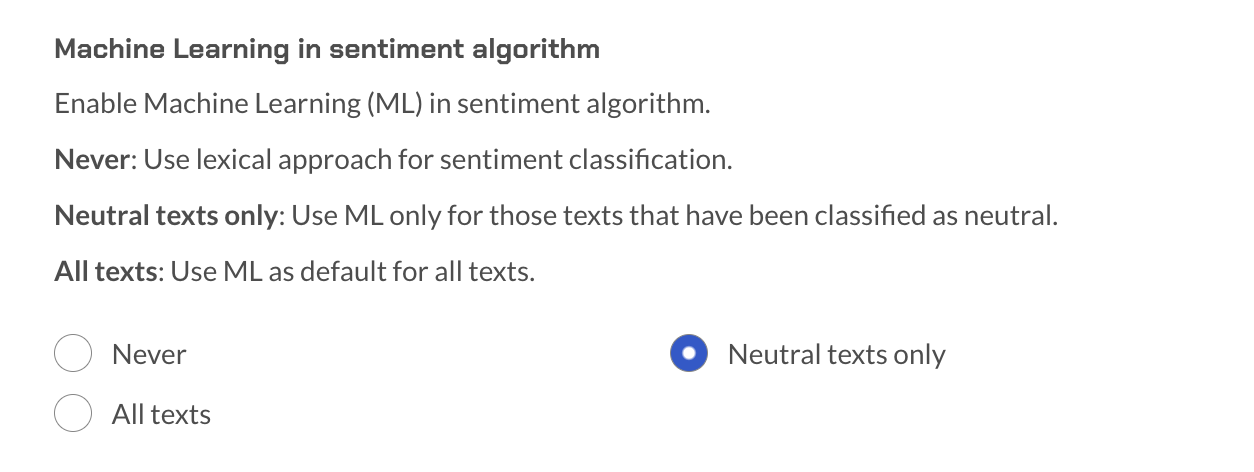
When the method "Binary" is selected, the user will be able to use Machine Learning (ML) to identify the sentiment of the texts. ML can be used for All texts or for those texts that the standard lexical approach classified as neutral.

-
-
Applying a Sentiment Customization to a project. Using a Customization when exploring the project will cause all related Sentiment Analysis to utilize this Customization. This includes Project & Topic Level Sentiments, sentiments in Excel and CSV reports, sentiments in Examples, and in the Gavagai Analysis Dashboards.
Dashboard
This section allows you to configure some global settings for the dashboard. Please note, changing one of these settings will cause the existing dashboard graphs to be re-generated based on the updated settings. Display settings for the individual graphs can be changed by clicking the 'Configure' icon on the graphs in the dashboard.
- Include only pinned topics in the graphs The default is to include all the topics from your project in the dashboard. Enable this setting if you want to include only the pinned topics.
- Metric used in the dashboard We try to identify columns which could be grades or ratings in your dataset and if we do find any such columns, we generate the dashboard using one of these columns as the metric. This setting allows you to change the column selected as the metric or use the calculated sentiments for the texts as the metric.
- Date column to use in timeseries graphs All the timeseries graphs in the dashboards need a date column from your dataset to use for the time axis. We try to identify potential date columns in your dataset, and select one of them to use for the timeseries graphs. If you would like to change the date column used in the timeseries graphs, you can do so here. Please note that this setting is only visible if we have detected more than one date column in your dataset.
Delete a project

You can remove a project from this section. You will be presented with a confirmation pop-up to ensure you don't delete a project accidentally. Please note that deleted projects cannot be restored and all data related to the project, including the dashboard and reports will be deleted.