Dashboard
The Explorer Dashboard is now powered by Apache Superset, which is a modern, enterprise-ready business intelligence web application that makes it easy for users of all skill sets to explore and visualize their data.
Prerequisite
Before generating, updating, or editing your dashboard in Explorer, it is highly recommended to have completed the project's modeling phase.
A well-structured and completed project model enhances the accuracy of the data visualizations, providing a more realistic portrayal of your text analysis results.
Modeling contributes to the reliability of quantified sentiment insights. The more refined and accurate your project model, the more trustworthy and actionable the sentiment insights derived from your data.
Model your project first
Remember, the accuracy of your visualizations and the reliability of any actionable insights derived from your data depend on the quality and completeness of your project model. Take the time to ensure your project model accurately reflects the intricacies of your text analysis data.
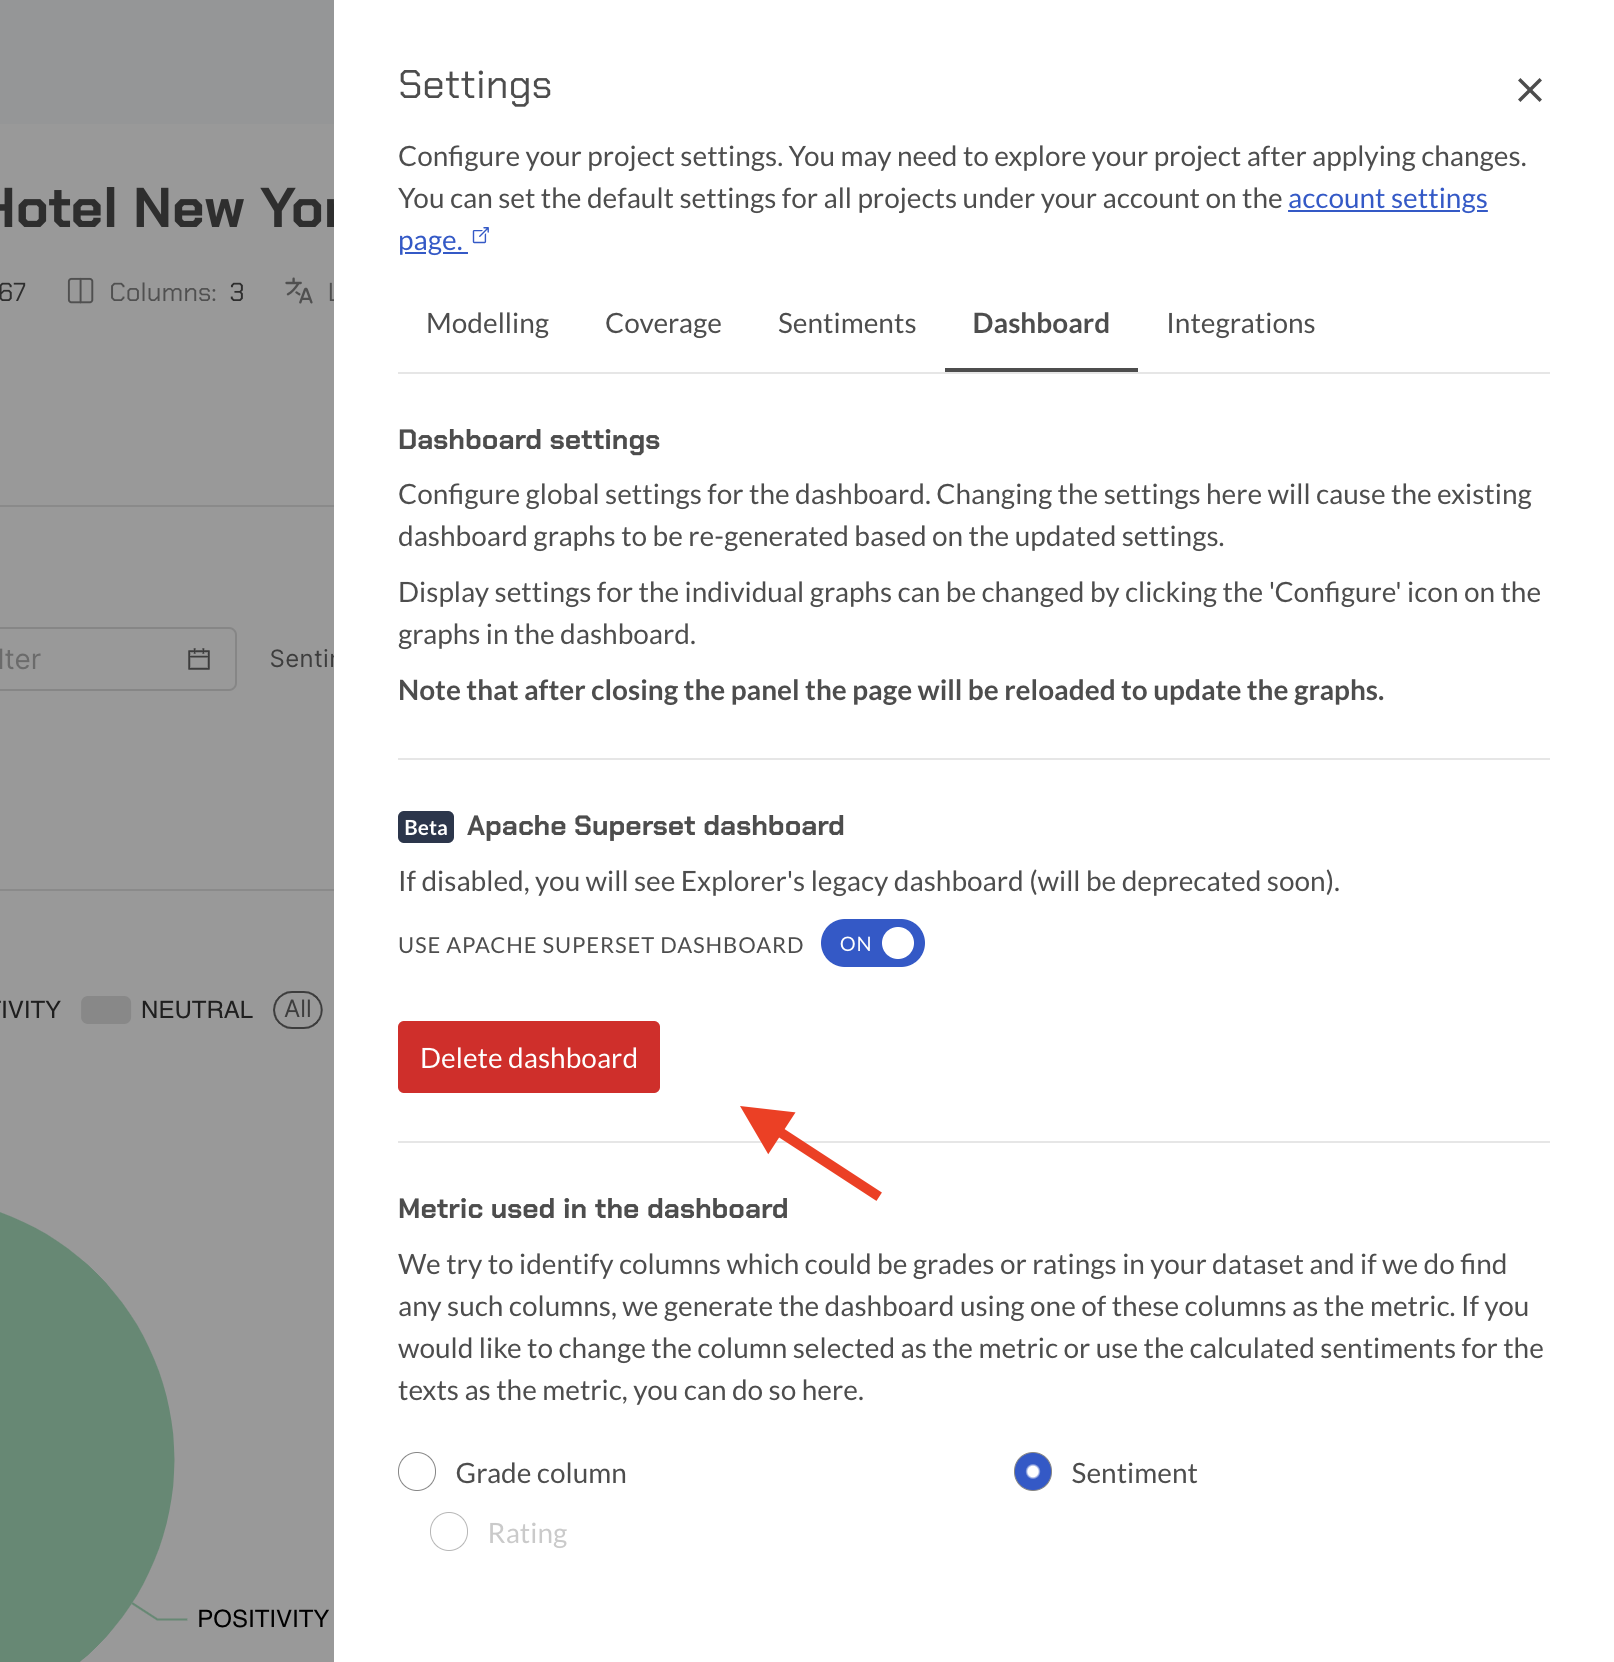
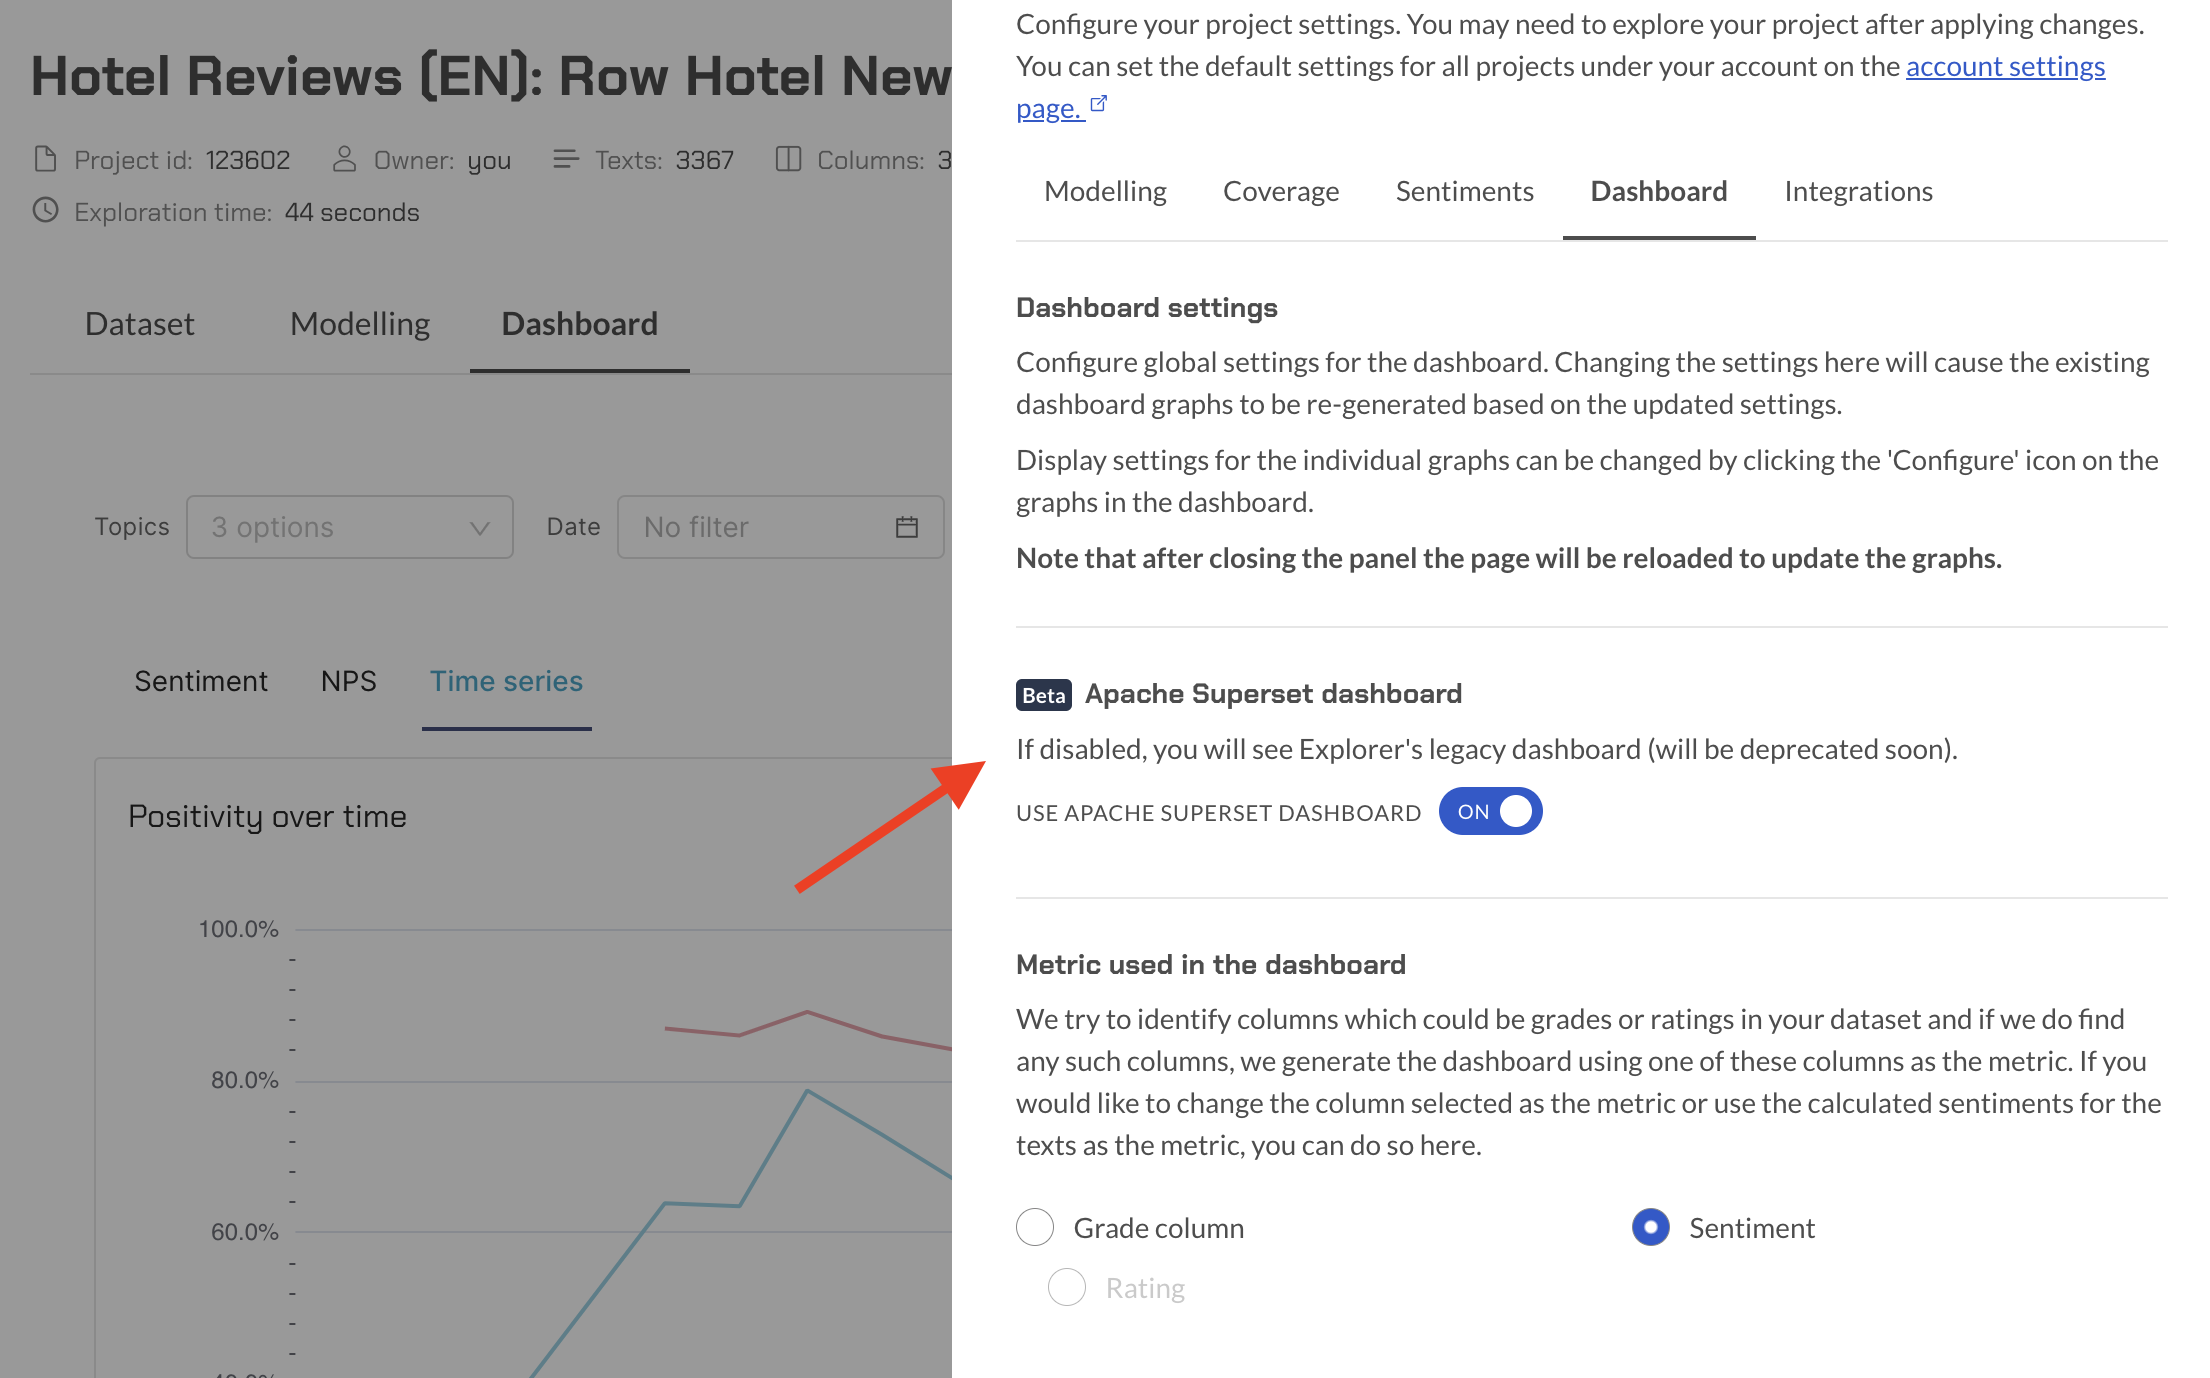
Enable the dashboard
All new projects will have the latest version of the Explorer Dashboard enabled by default but for old projects users can enable it on a project page in the dashboard section of the settings menu.
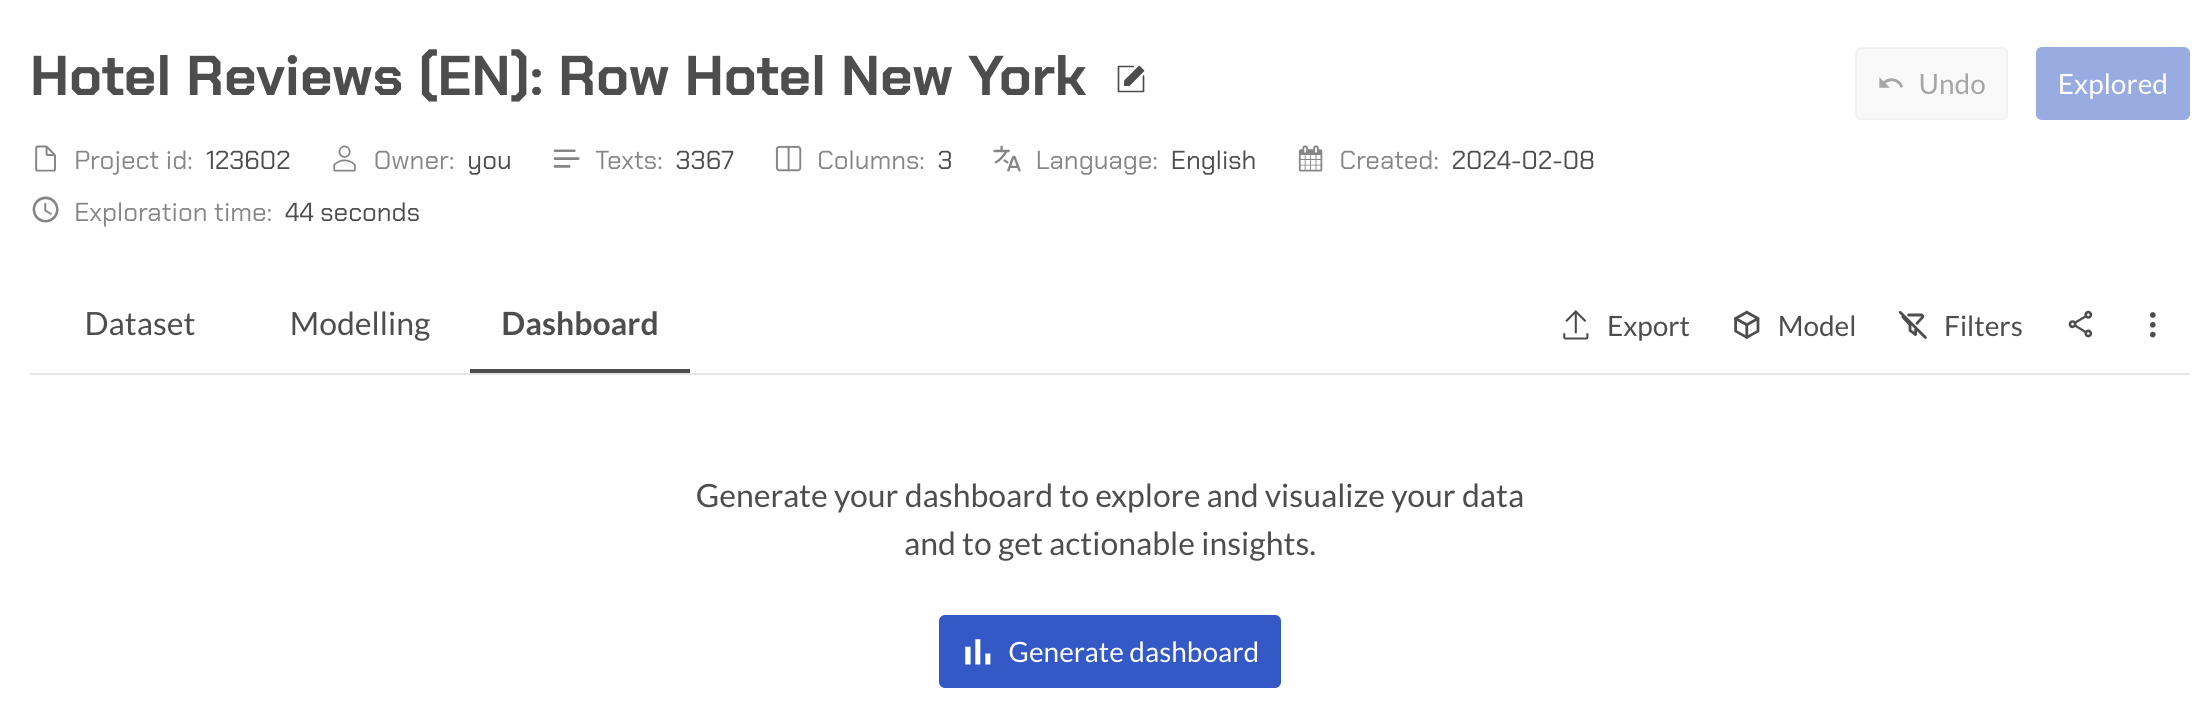
How to create a new dashboard
On the project page, click on the "Dashboard" tab. This tab is specifically designed for visualizing and exploring your data. If it's your first time creating a dashboard for this project, you will need to initiate the process. Click on the "Generate Dashboard" button.
The system will automatically export the relevant data to Apache Superset, an open-source data exploration and visualization platform. This step ensures that your text analysis data is prepared for visualization. The system will now generate a dashboard based on the exported data. This may take a few moments, depending on the size and complexity of your data.
Once the dashboard is generated, it will be embedded inside an iframe within the current page. You can seamlessly view and interact with the dashboard without leaving the Explorer.
Mind your filters
If you have applied filters to your project's data only the filtered data will be exported for your dashboard.
Configuration
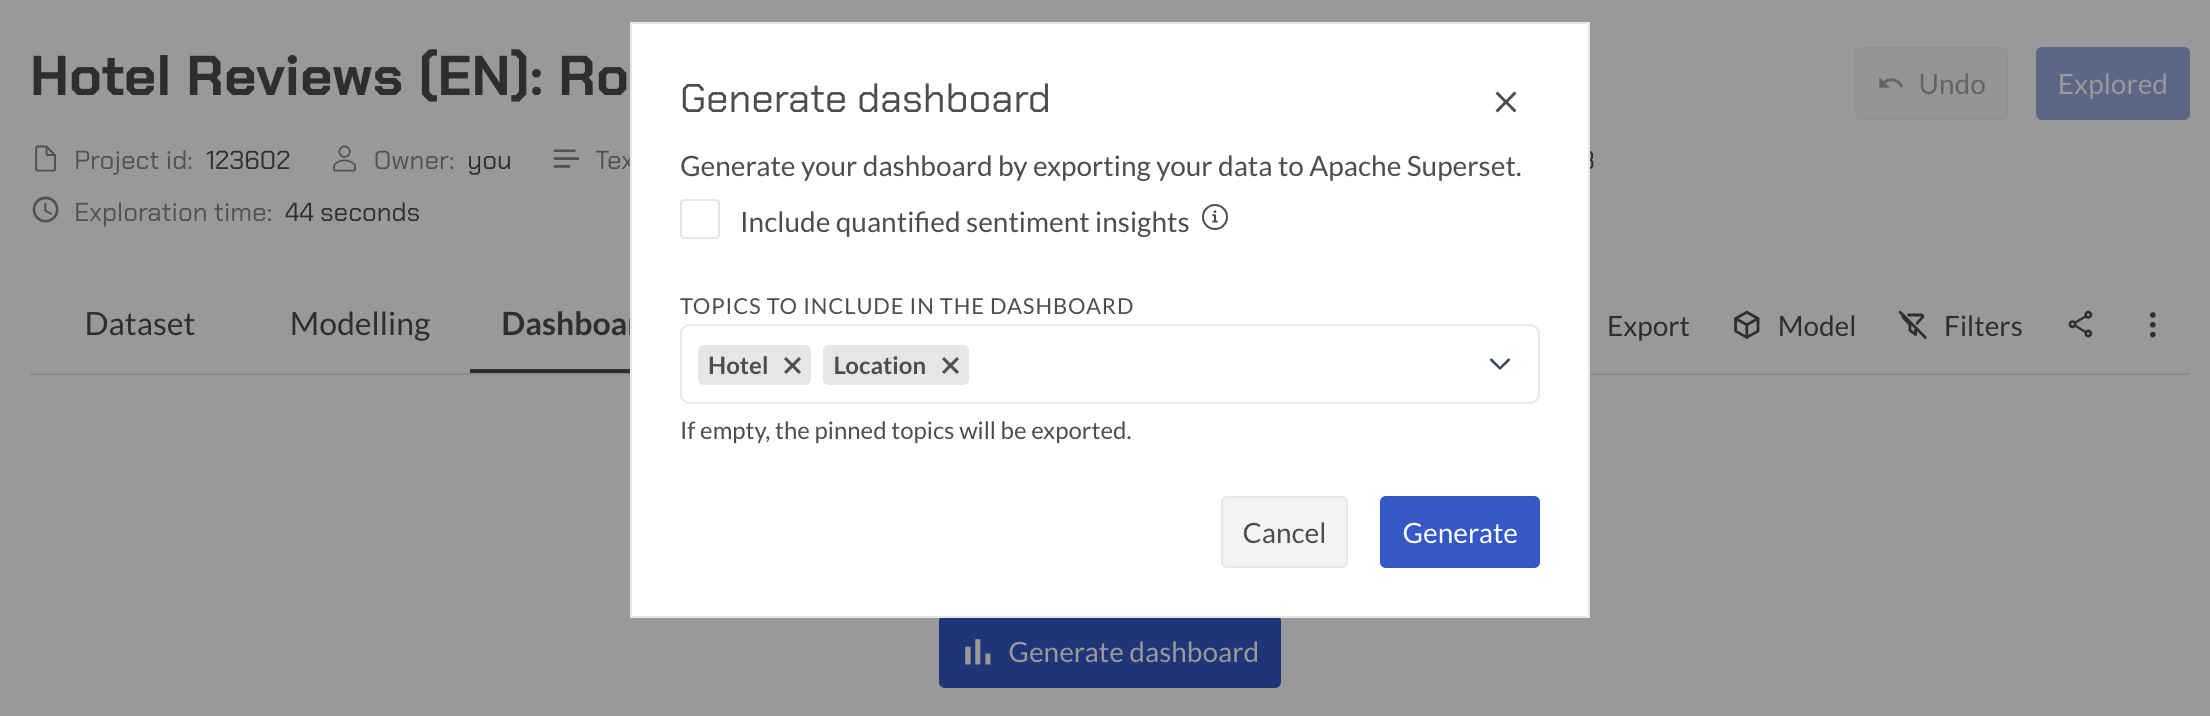
After clicking the "Generate Dashboard" button, a configuration modal will pop up before the dashboard is generated.
The modal provides an advanced AI-feature called QSI, or Quantified Sentiment Insights (see the next section for further information). When enabled, QSI generates insightful information for each of the selected topics, offering deeper analysis and understanding.
In the modal, you have the option to select which topics you want to include in the dashboard. If left empty, the system will automatically include the pinned topics associated with the selected project.
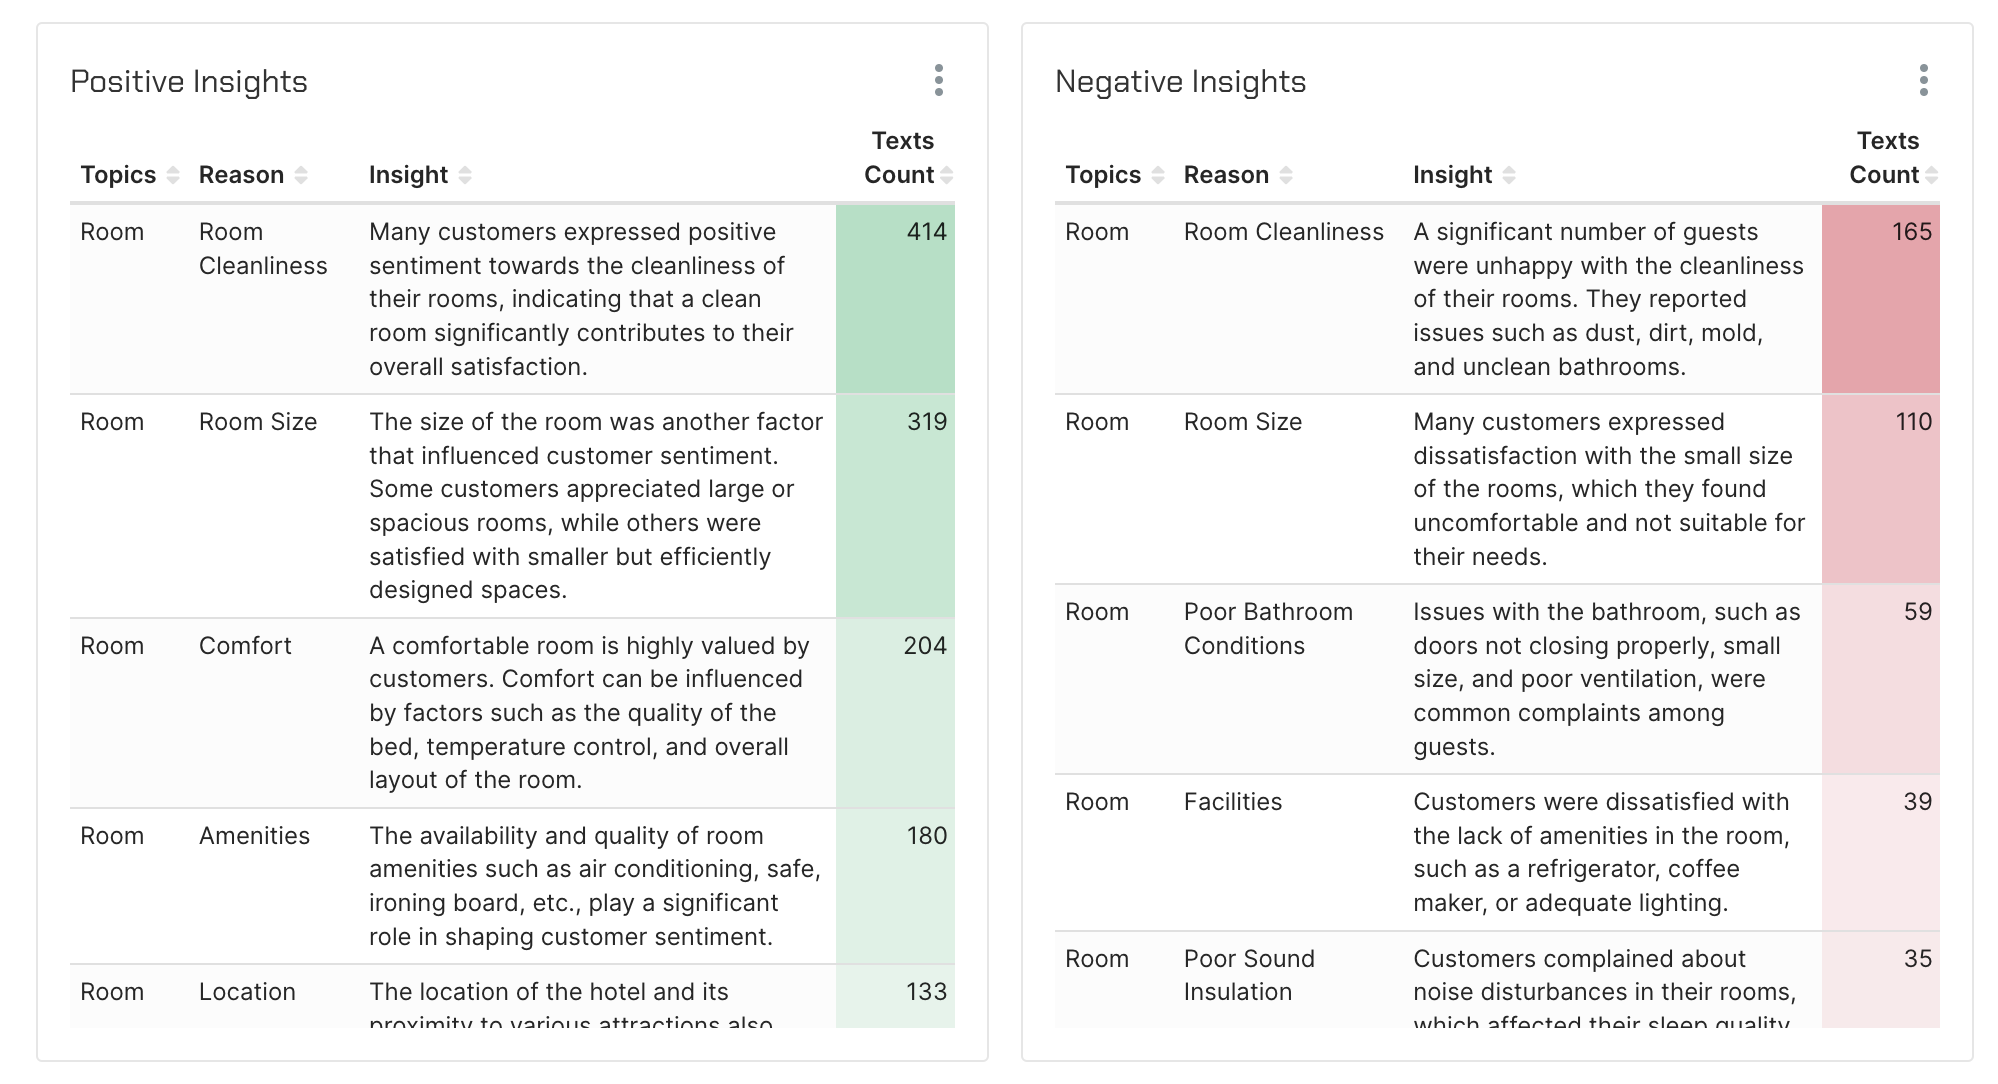
Quantified sentiment insights
The QSI feature in Explorer is an advanced AI-driven capability designed to provide comprehensive insights into topics by uncovering sentiment reasons within the associated texts. It identifyies and elaborates on the reasons behind sentiment expressions related to a specific topic.
A topic comprises the name of the topic, the terms that define it, and snippets of text containing any of the topic terms. The QSI engine takes as input a Topic object, which encapsulates the details of the topic, and a list of sentiments for which the system aims to identify the reasons expressed in the associated texts. After the input is processed, the user will see for each topic a:
- Reason: A brief description of the cause for the expression of sentiment.
- Insight: An elaboration on the reason, typically presented as a sentence.
- Examples: A list of text snippets from the topic that supports the identified reason. It's important to note that a text snippet may be assigned to multiple reasons, capturing the complexity and nuances of sentiment expression.
Overlap of sentiment reasons
Sentiment reasons identified by QSI may overlap, providing a more comprehensive understanding of the multifaceted nature of sentiments expressed within the topic.
In the dashboard, two charts with insights will be created, one for positive sentiment and one for negative:
Update dashboard
Note that this option is only available if you are the owner or an editor of the project.
If you have already generated a dashboard and need to refresh it with the latest data, you can follow these steps to update the dashboard. The update process involves using the same modal as the one used for generating a new dashboard, but with an additional checkbox for appending data to the existing dataset.
- Locate and click on the "Update Dashboard" button, just above the dashboard. This will trigger the update process for the existing dashboard.
- Similar to the dashboard generation process, a configuration modal will appear to allow you to configure the data export settings. Configure the topics you want to include in the updated dashboard using the "Topics" dropdown.
- Append data: in the modal, you will find an additional checkbox to append data. This checkbox allows you to choose whether to append the newly generated data to the currently existing dataset. This option is useful when you want to retain historical data while incorporating new insights into your existing dashboard.
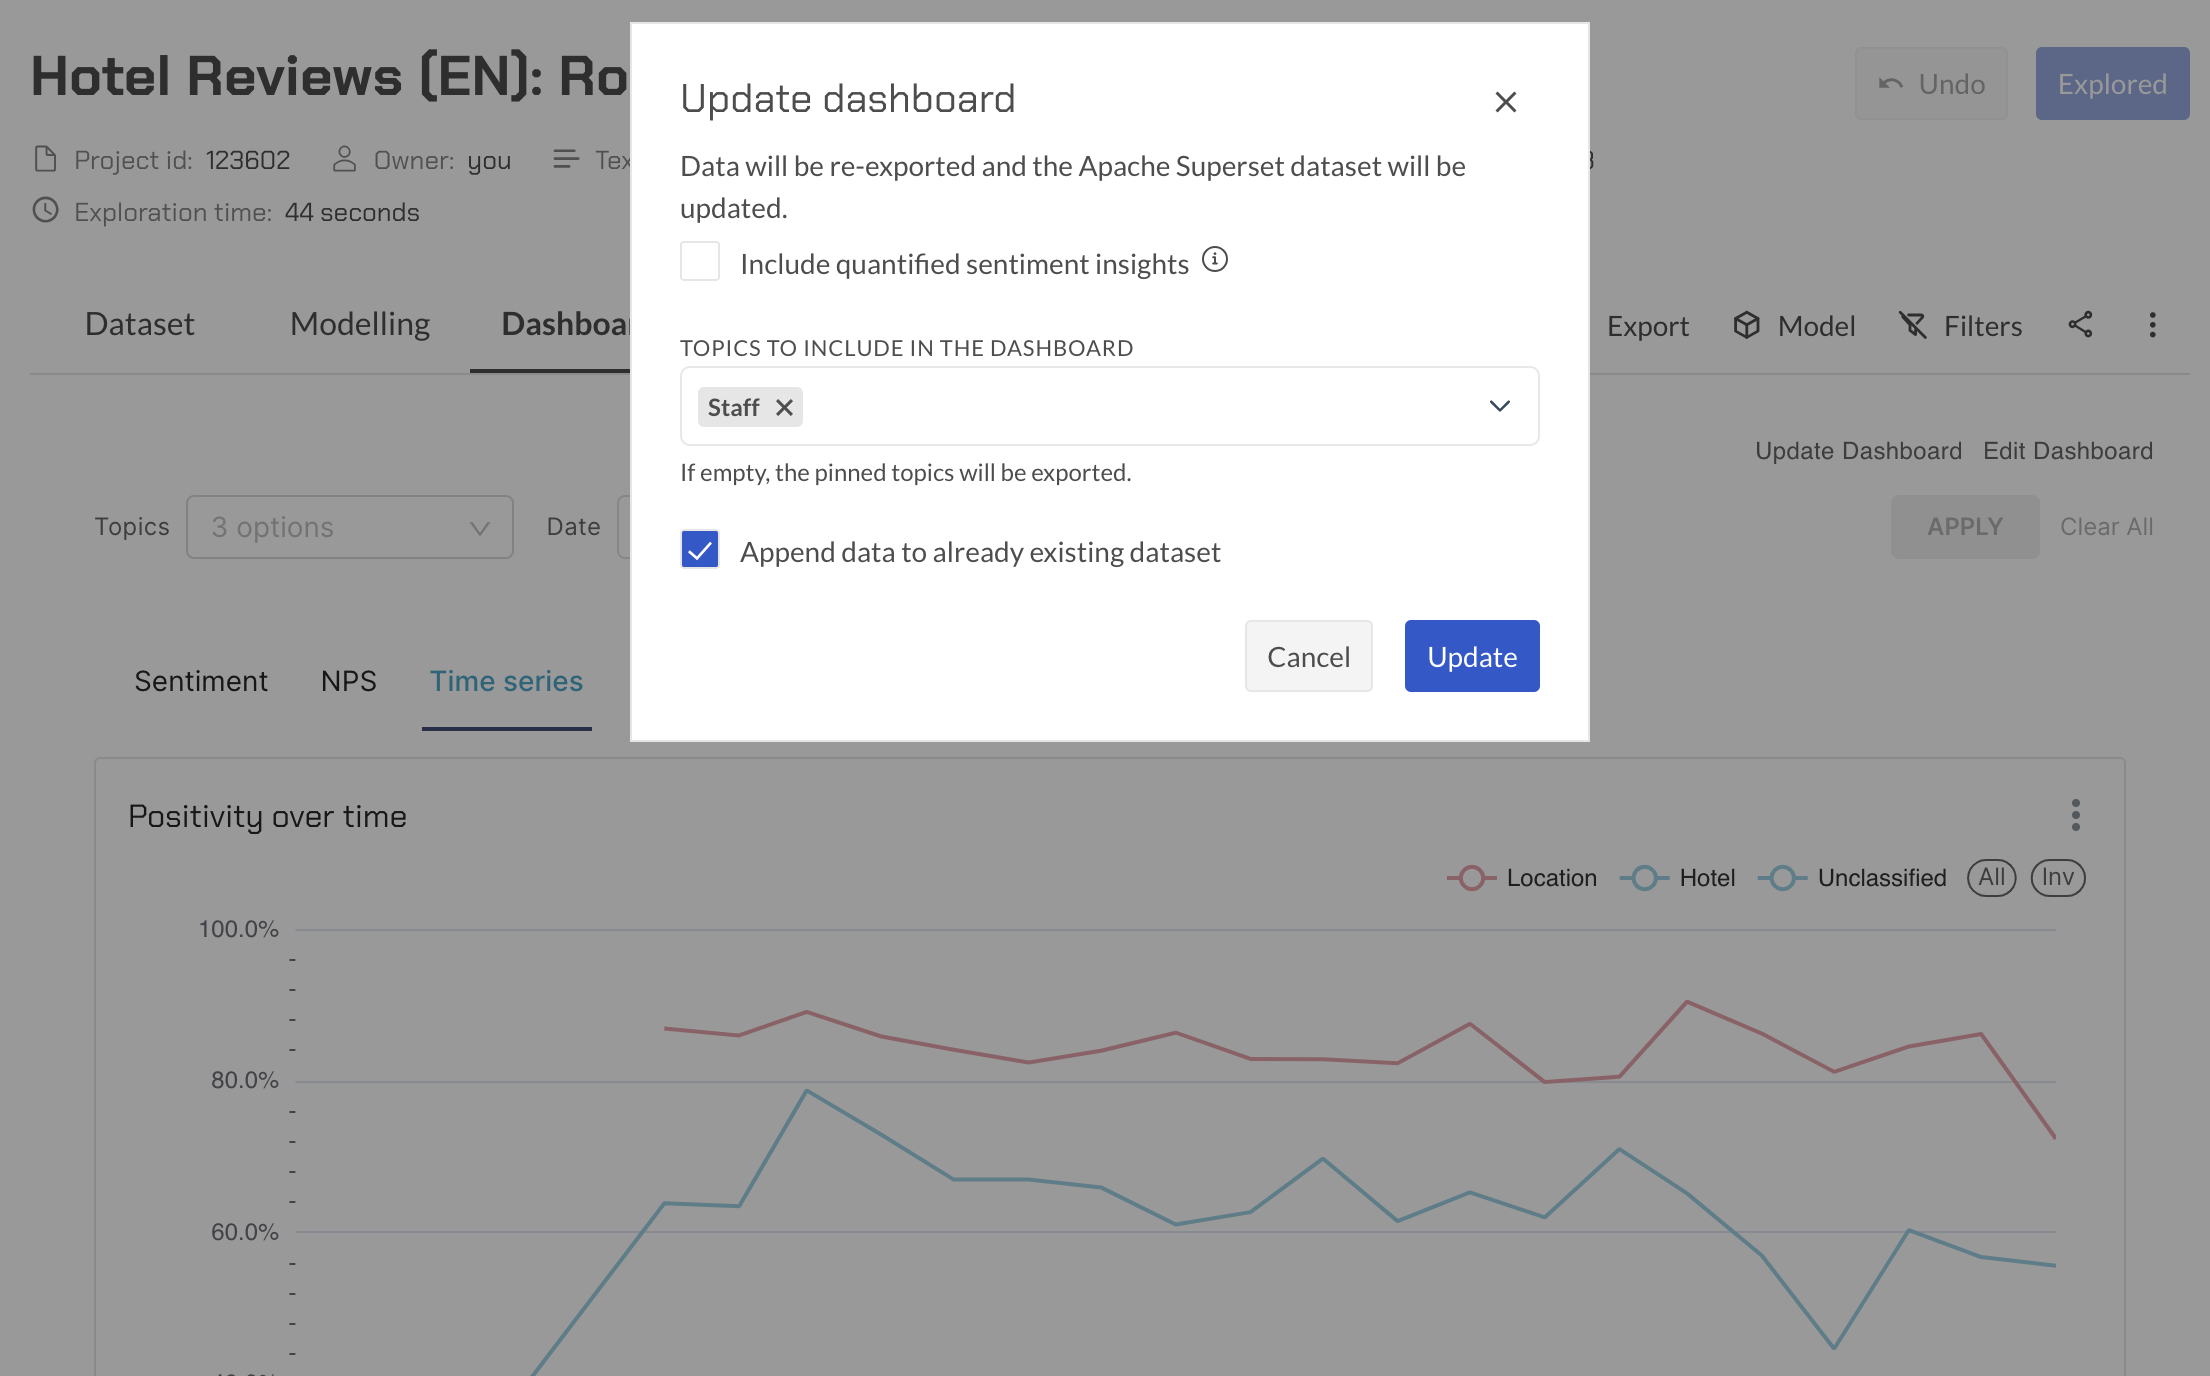
Once the update is complete, the existing dashboard will be refreshed with the latest data, and any new data will be appended to the existing dataset.
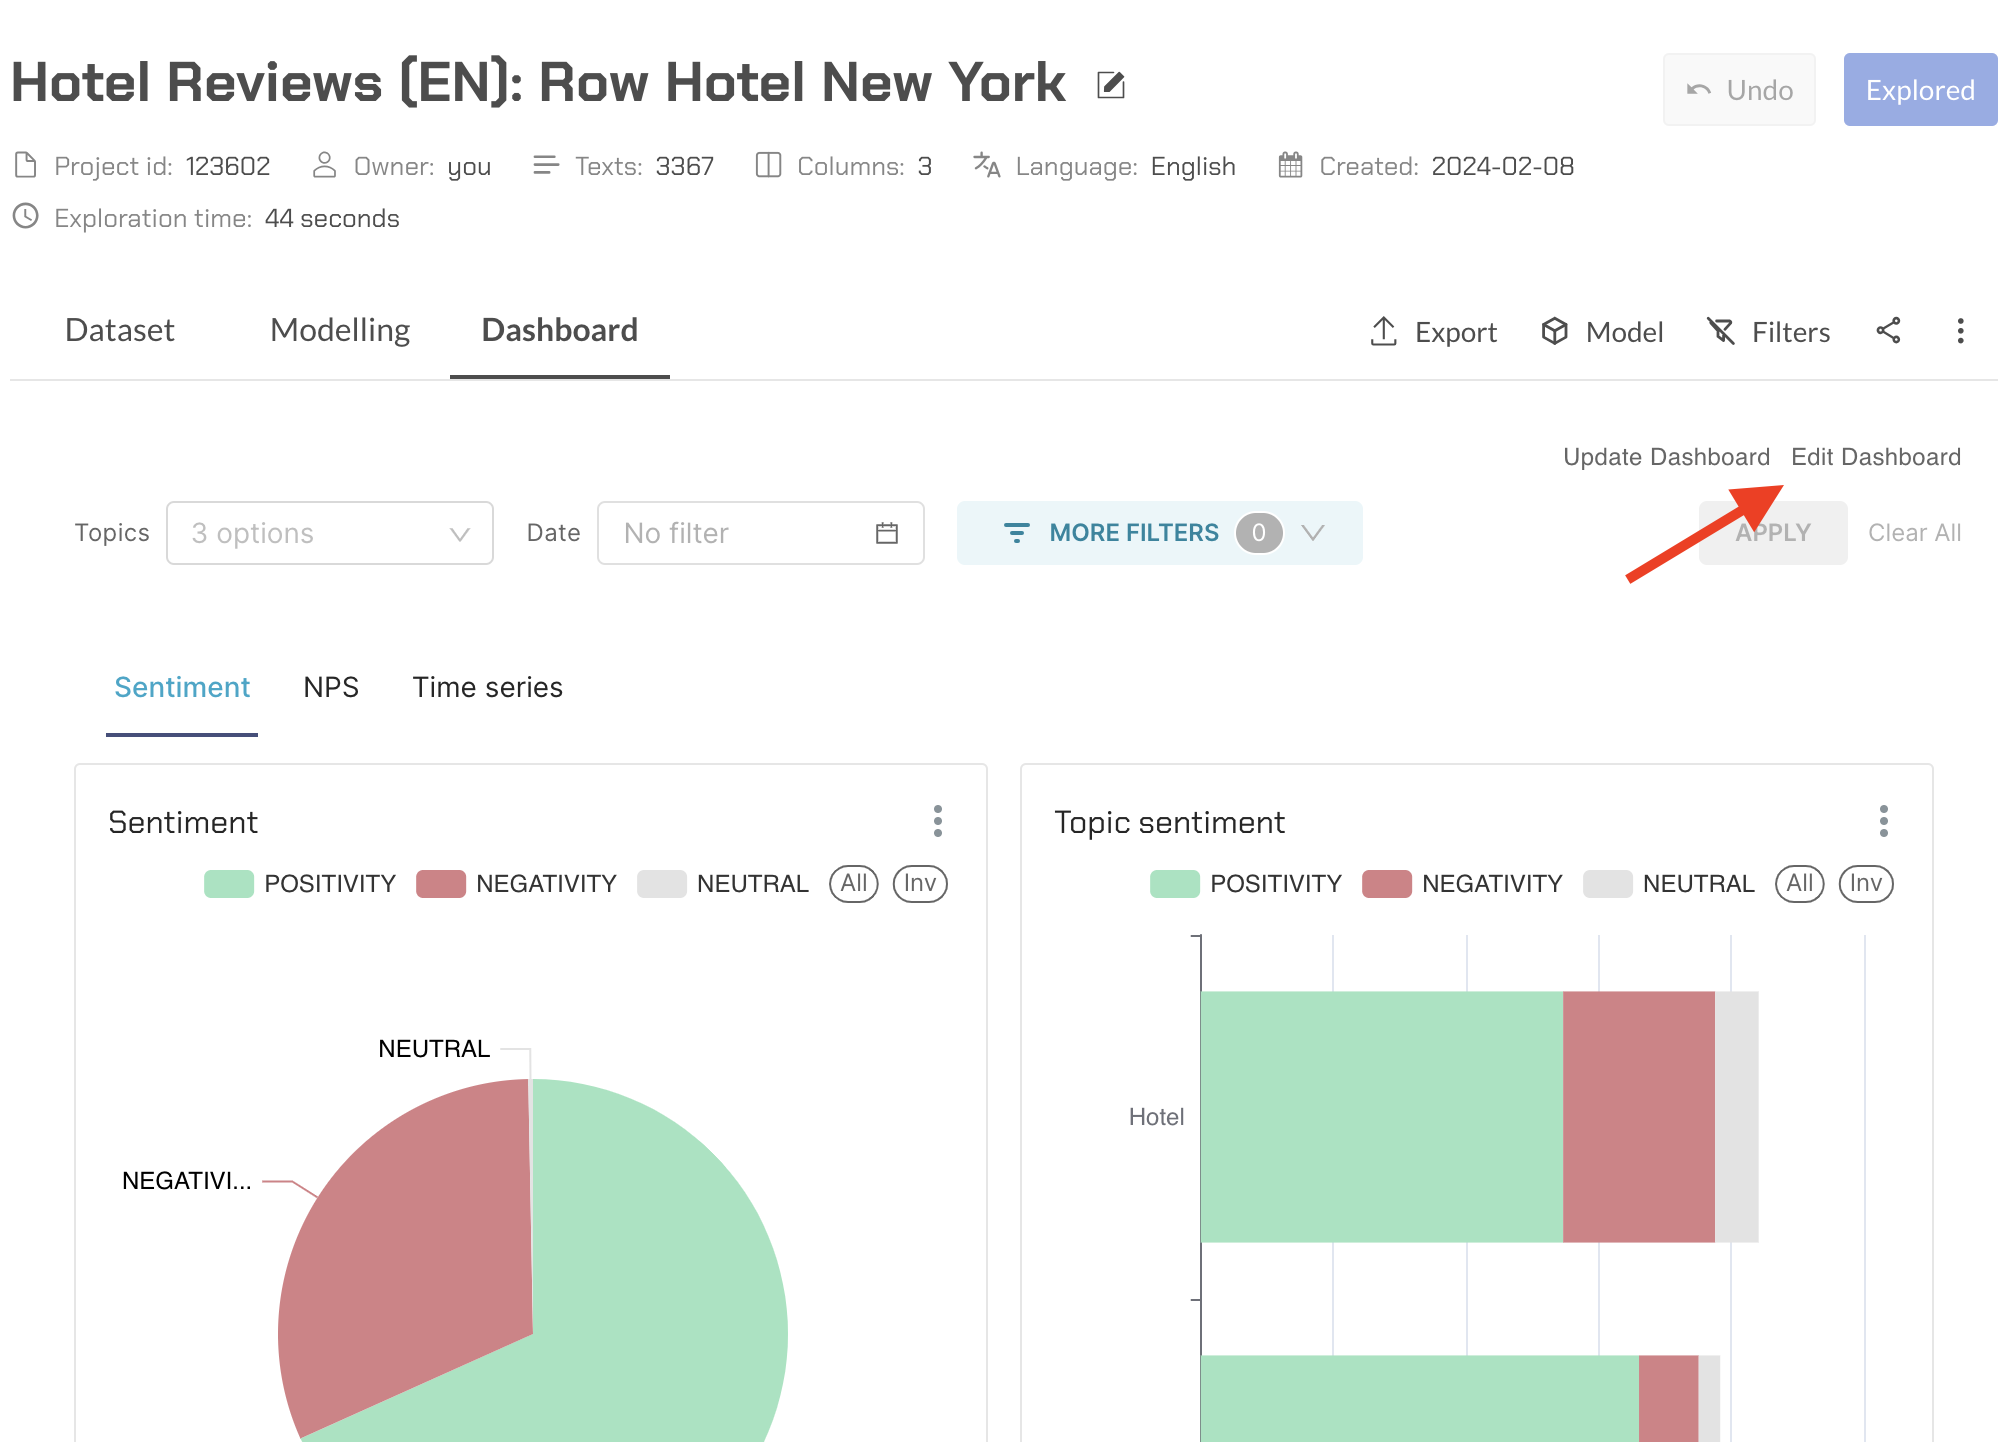
Edit dashboard
Note that this option is only available if you are the owner or an editor of the project.
To edit your dashboard, click on the provided link. This link will redirect you to the Apache Superset platform.
If prompted, log in to Apache Superset using the same credentials as your Explorer account. This ensures a secure and integrated experience.
Once logged in, you will be directed to the Apache Superset dashboard editing interface. Here, you have the freedom to customize your dashboard further. Explore the available chart options and add new visualizations to your dashboard. Apache Superset offers a variety of chart types to suit your data visualization needs. Tailor the appearance of your dashboard by adjusting colors, layouts, and other visual elements. Customize the dashboard to align with your preferences and the specific requirements of your analysis.
After making the desired edits, be sure to save your changes. This ensures that the modifications are reflected when you revisit your dashboard within the Explorer.
Delete dashboard
Note that this option is only available if you are the owner or an editor of the project.
In the dashboard section of the settings menu, you can delete the dashboard. Note that, after doing so, you will need to regenerate the dashboard again. Follow the steps for generating a dashboard as outlined earlier in the documentation, ensuring that the data export includes the necessary configurations.