PowerBI
The integration is currently in BETA. If you find any errors, you are welcome to contact our support team at support@gavagai.io.
The same goes if you are missing any functionality or if you have ideas how to make the connector better. We would be extremely grateful if you could show us how you are using Power BI in your daily work and how you are visualizing the data you get from Gavagai Explorer.
How to enable the integration
Prerequisites
- You need to have installed Power BI Desktop on Windows.
- In Gavagai Explorer you have to have created at least one project containing the data you want to connect to.
- That project’s Coverage settings have to be set to “Only pinned”.
For optimal results:
- Make sure you have pinned all of your important topics.
- Use groups to create a topic hierarchy.
Enable PowerBI
Inside Explorer
- Open the project(s) you want to connect to.
- Explore the project if there are any pending changes.
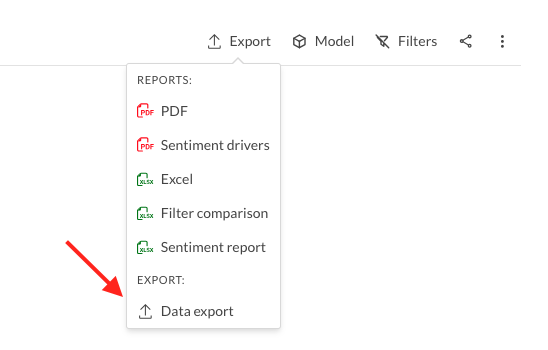
- Export data from the reports menu
- If you haven’t already, set Coverage settings to “Only pinned”.
On your computer
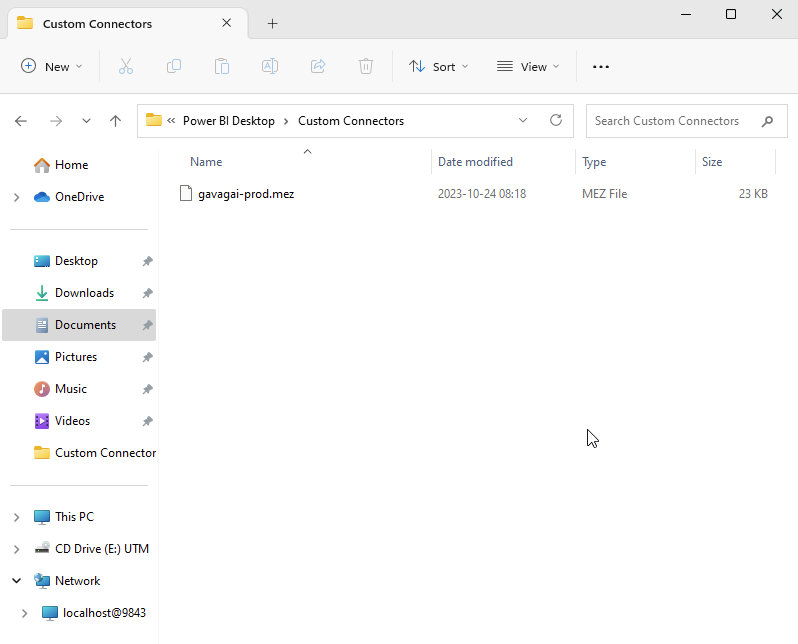
Download the .mez file containing the custom connector: gavagai-prod.mez.
Copy the file to /Documents/Power BI Desktop/Custom Connectors
You may have several Documents folders depending on your local file structure. If the Power BI Desktop and Custom Connectors folders don’t exist, you can create them.
Inside Power BI
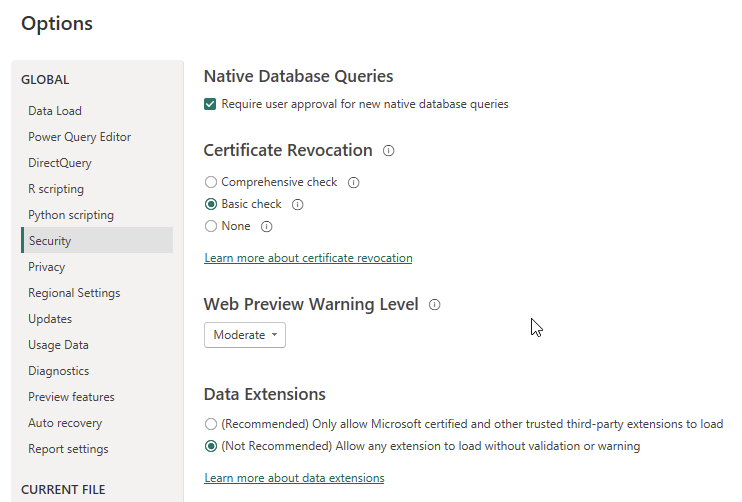
- Go to
File > Options and settings > Options. - Click on Security.
- Under Data Extensions, allow the second option:
🔘 (Not Recommended) Allow any extension to load without validation or warning - Press OK to confirm your changes.
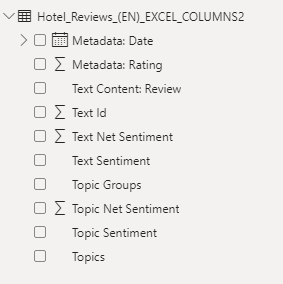
Available data
The following data is available through the connector:
- Metadata: Any metadata columns present in the data are exported.
- Text Content: The text column.
- Text Id: An internal identifier that can be used to differ between identical texts.
- Text Net Sentiment: A numerical value between -1 (completely negative) to 1 (completely positive) to express the sentiment for a text.
- Text Sentiment: A sentiment label for the overall sentiment of a text (POSITIVE, NEGATIVE or NEUTRAL).
- Topic Groups: A label based on the topic group (equal to the topic label if the topic wasn’t grouped).
- Topic Net Sentiment: A numerical value between -1 (completely negative) to 1 (completely positive) to express the sentiment for a topic.
- Topic Sentiment: A sentiment label for the overall sentiment of a topic (POSITIVE, NEGATIVE or NEUTRAL).
- Topics: A label based on the topic.
Connecting to Explorer data
Inside a Power BI report
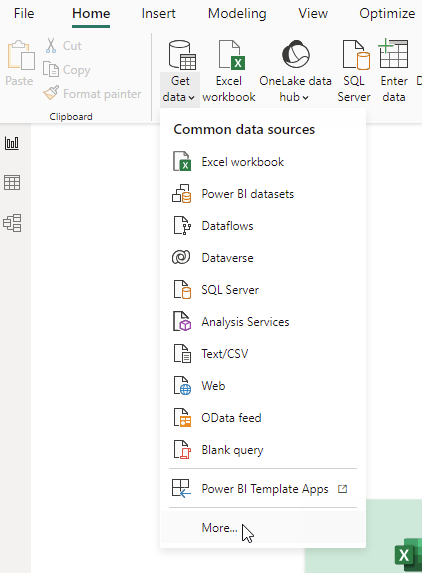
- Click on Get data from another source or go to Home and click on the Get data icon or go to
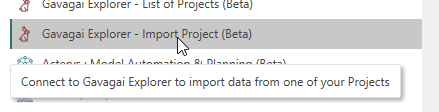
Home > Get dataand click on More… (see images below) - In the list, search for “gavagai” and choose Gavagai Explorer - Import Project (Beta).
- Click on Connect.
- Sign in using your Gavagai Explorer credentials.
- Choose the project(s) you want to connect to and click on Load to connect to its data.
Metrics and visualizations
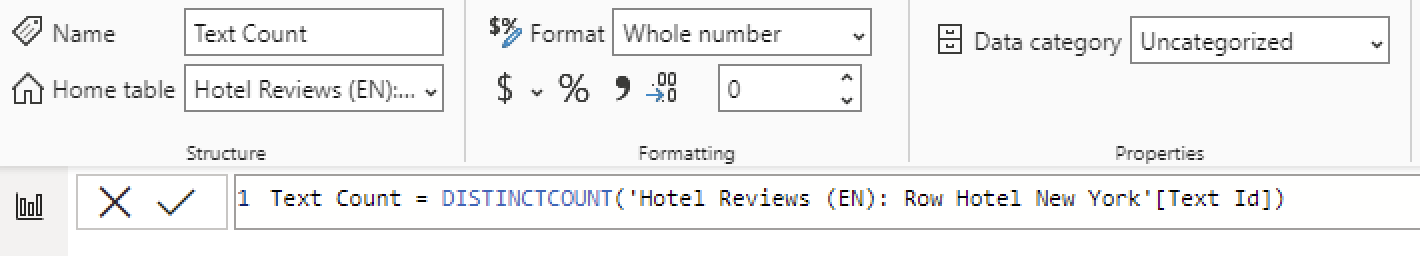
Metric: Text Count
This metric is essential for most visualizations.
- Go to
Modeling > New measure. - Enter the query and confirm:
Text Count = DISTINCTCOUNT('your_dataset'[Text Id])
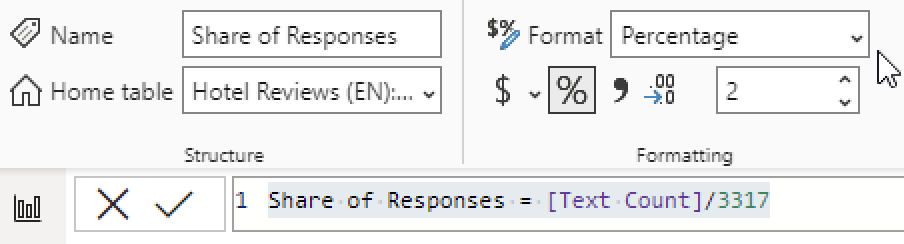
Metric: Share of Responses
You need Text Count to create this metric.
- Note down the total amount of texts in your current project (if you are unsure, you can easily get this by creating a Card visualization with Text Count).
- Go to
Modeling > New measure. - Enter the query and confirm:
Share of Responses = [Text Count]/amount_of_texts
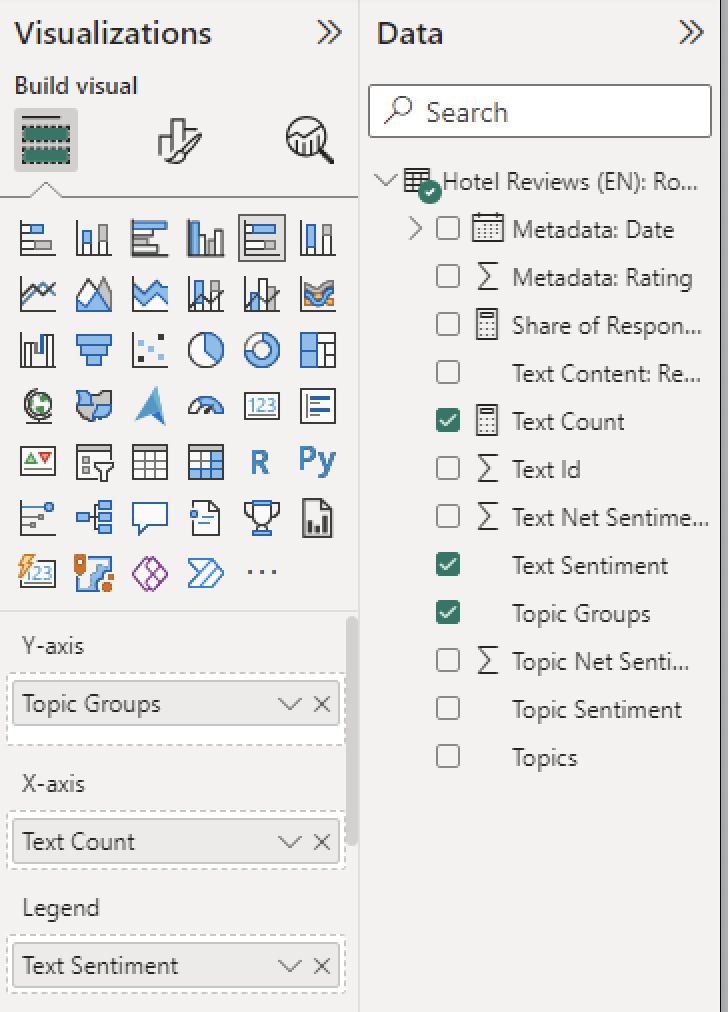
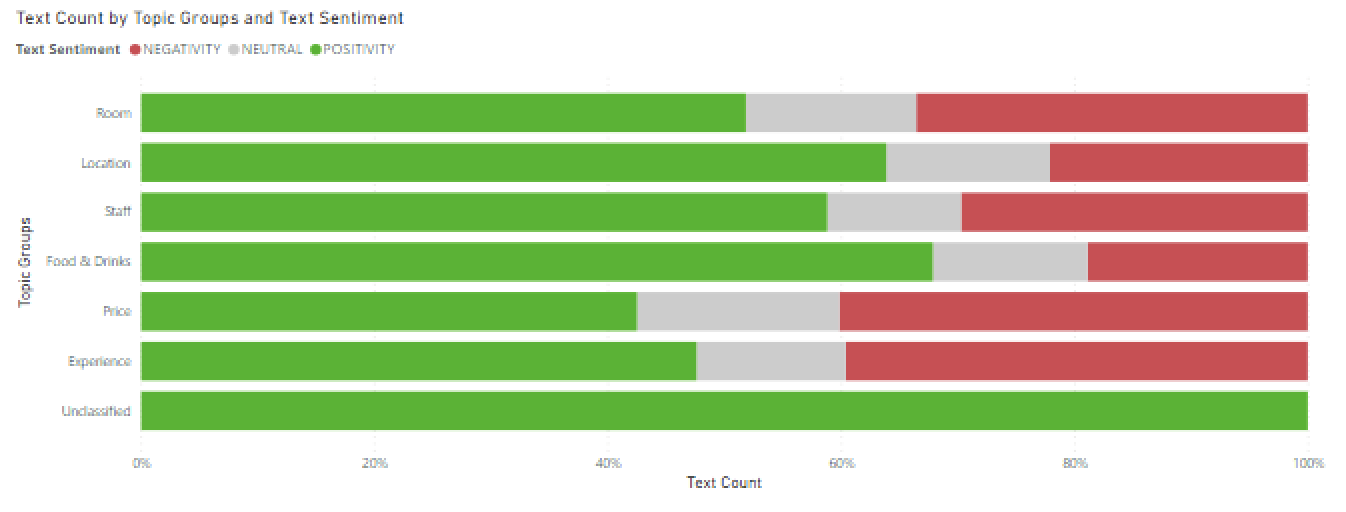
Visualization: Sentiment Bars
- Select 100% Stacked bar chart.
-
Use the following fields:
- Y-axis: Topic Groups (or Topics)
- X-axis: Text Count
- Legend: Topic Sentiment (or Text Sentiment)
-
Change the bar colours to match the respective sentiment.
Filtering
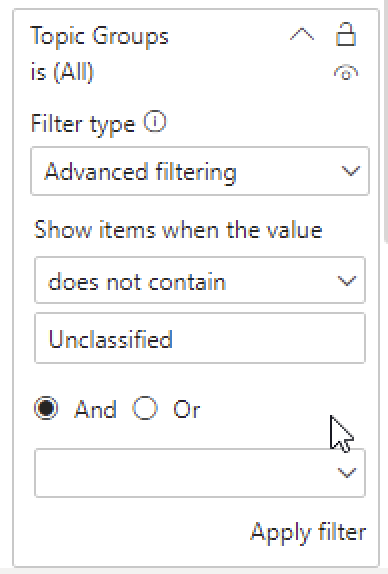
Remove Unclassified Sometimes, for example when working with Topic Sentiment, it’s better to not consider texts with the ‘Unclassified’ label in a visualization.
- In the filter pane, click on the filter options for Topics or Topic Groups (you may need to add them from your list of fields; one of them suffices).
- Choose "Advanced filtering" as Filter type.
- Choose "does not contain" and enter "Unclassified".
- Apply the filter.